
•21 patients without fatty liver disease and 92 patients with NAFLD.
•Their general information was collected and BMI was calculated. Routine blood test, liver function evaluation, and measurement of blood lipid, serum insulin, and alpha-fetoprotein were performed, and liver CT and FibroTouch were performed.
•The ROC curve was plotted with liver/spleen CT ratio as diagnostic criteria, and the ROC curve was used to evaluate the ability of controlled attenuation parameter (CAP) to diagnose NAFLD.
•The area under the ROC curve (AUC) was calculated, the Z test was used to evaluate diagnostic effectiveness, and Youden index was used to determine the optimal cut-off value.
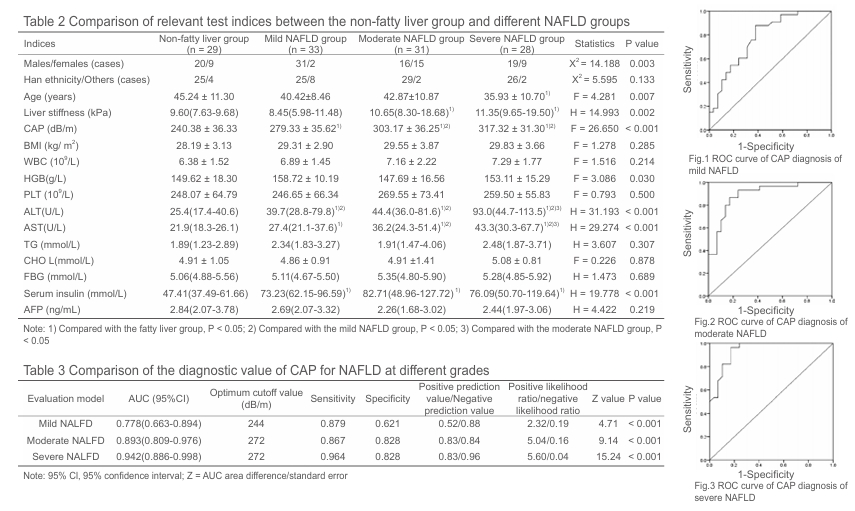
•There were significant differences in age, alanine aminotransferase (ALT), aspartate aminotransferase (AST), serum insulin, fat attenuation, and liver stiffness measurement (LSM) between the patients without fatty liver disease and those with varying degrees of NAFLD (all P < 0. 05).
•The severe NAFLD group had a significantly lower mean age than the non-fatty liver disease group (P < 0.001).
•There was a significant difference in CAP between the non-fatty liver disease group and the groups with varying degrees of NAFLD (all P < 0.001) , while there was no significant difference in CAP between the moderate and severe NAFLD groups (P = 0.127).
•There was a significant difference in LSM between the non-fatty liver disease group and the moderate NAFLD group (P = 0.034) , as well as between the non-fatty liver disease group and the severe NAFLD group (P < 0.001), while there was no significant difference between the moderate and severe NAFLD groups (P = 0.327).
•There were significant differences in the levels of ALT and AST between the non-fatty liver disease group and the groups with varying degrees of NAFLD (all P < 0.001) , and the severe NAFLD group had significantly higher levels of ALT and AST than the mild NAFLD group (both P = 0.001).
•There was a significant difference in the level of insulin between the non-fatty liver disease group and the groups with varying degrees of NAFLD, while there was no significant difference between the groups with varying degrees of NAFLD (all P > 0.05).
•The optimal cut-off values of CAP for the diagnosis of mild, moderate, and severe NAFLD were 244 dB/m, 272 dB/m, and 272 dB/m, respectively, with AUC of 0.778 (95% confidence interval [CI]: 0.663-0.894), 0.893 (95%CI: 0.809-0.976), and 0.942 (95%CI: 0.886-0.998) (all P < 0.001).