
ACADEMIC HISKY
Comparison of FibroTouch and FibroScan for the assessment of fibrosis in chronic hepatitis B patients
Duan Weijia, Ou Xiaojuan, et al. Chin J Exp Clin Virol, 2018, 32(4)
Objective
•To explore the diagnostic values of FibroTouch and FibroScan for liver fibrosis in CHB patients.
Methods
•133 patients accepted liver biopsy.
•FibroTouch and FibroScan were performed among these patients at the same time.
•LSM, optimal cut-off value, ROC were compared.
Figures & Tables
Results
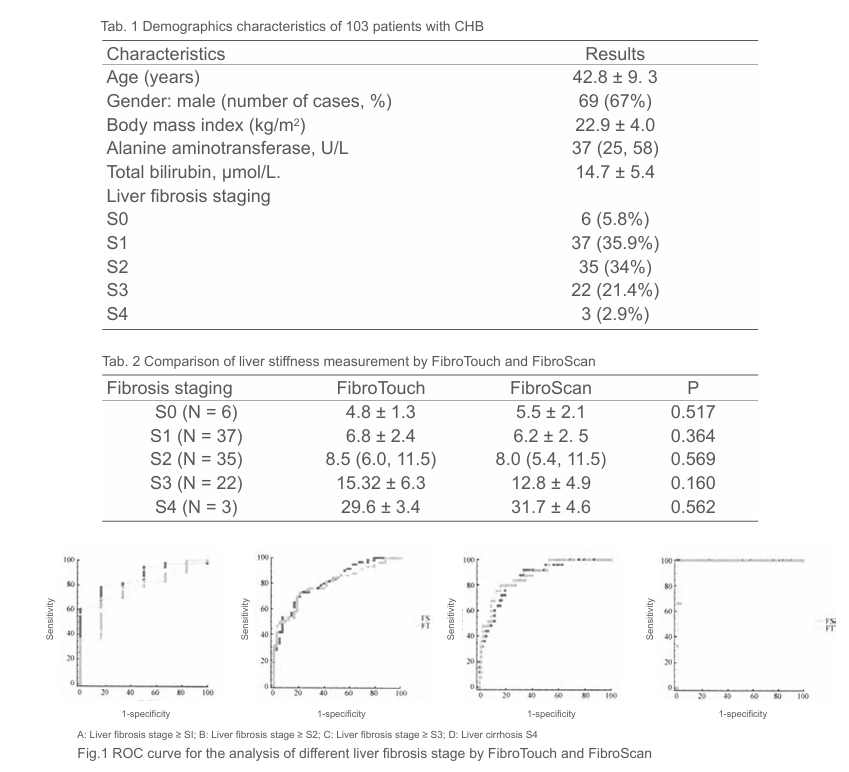
•There were no significantly different between FibroTouch and FibroScan in LSM.
•The threshold of the optimal cut-off value for FibroTouch and FibroScan were 5.45 versus 5.55 kPa (≥ S1), 7.10 versus 6.65 kPa (≥ S2), 11.05 versus 9.20 kPa (≥ S3) ,15.50 versus 15.45 kPa (S4) , respectively.
•The area under the ROC curve for the prediction of the stage1, stage2, stage3, stage4 of liver fibrosis in these patients were 0.858 versus 0.765 (P = 0.54) , 0.812 versus 0.801 (P = 0.68) , 0.863 versus 0.878 (P = 0.45) , and 1.0 versus 0.99 (P = 0.38) respectively.
Conclusion
•FibroTouch and FibroScan have a good consistency in the evaluation of the degree of liver fibrosis in patients with CHB.
If you need more academic materials, please contact us.